App performance optimization: a developer's complete guide

App performance optimization is the systematic, iterative process of identifying and resolving technical bottlenecks that degrade an application's speed, responsiveness, and stability. It spans the full app lifecycle, from architecture decisions made during prototyping to ongoing profiling conducted after deployment. The goal is not a single fix but a continuous cycle of measurement, diagnosis, and targeted improvement.
At its core, the discipline addresses bottlenecks like latency, memory leaks, and inefficient resource use. Key concepts include:
- Perceived vs. measured performance: perceived performance reflects how fast an app feels to users; measured performance reflects instrumented data from profiling tools. Optimising only one dimension frequently fails to satisfy the other.
- Latency percentiles: P95 and P99 metrics capture the experience of your worst-affected users, not just the average.
- Resource usage: CPU, memory, battery, and network consumption all affect stability and speed.
- Bottleneck scope: issues may originate in code, architecture, network conditions, or device hardware.
Why poor app performance costs you users and revenue
Slow apps lose users fast. 53% of mobile users abandon an app that takes longer than 3 seconds to load, and 88% are unlikely to return after a bad experience. Those numbers alone reframe performance work from a technical nicety to a business priority.
The business consequences compound quickly:
- Conversion rate: each additional second of load time drops conversion rates by roughly 4.42% in the first five seconds.
- Uninstalls: 62% of users will remove an app that crashes frequently.
- Stability benchmark: the industry standard for crash-free sessions is very high, close to perfect stability.
- Resource efficiency: well-optimised apps consume less CPU and memory, which reduces infrastructure costs and extends device battery life.
- Scalability: apps built with performance in mind handle traffic spikes without degrading for every user.
The industry benchmark is a crash-free session rate of 99.95% or higher. Anything above a 2% crash rate is considered critical and warrants immediate attention.
Performance also shapes perception. An app that feels fast earns trust, generates longer sessions, and produces fewer support complaints. The technical and business cases point in exactly the same direction.
What app performance optimization actually looks like in practice
The most effective approach to app performance improvement follows a structured, five-phase iterative cycle rather than ad hoc fixes. Each phase builds on the previous one, and the cycle repeats continuously as the app evolves.
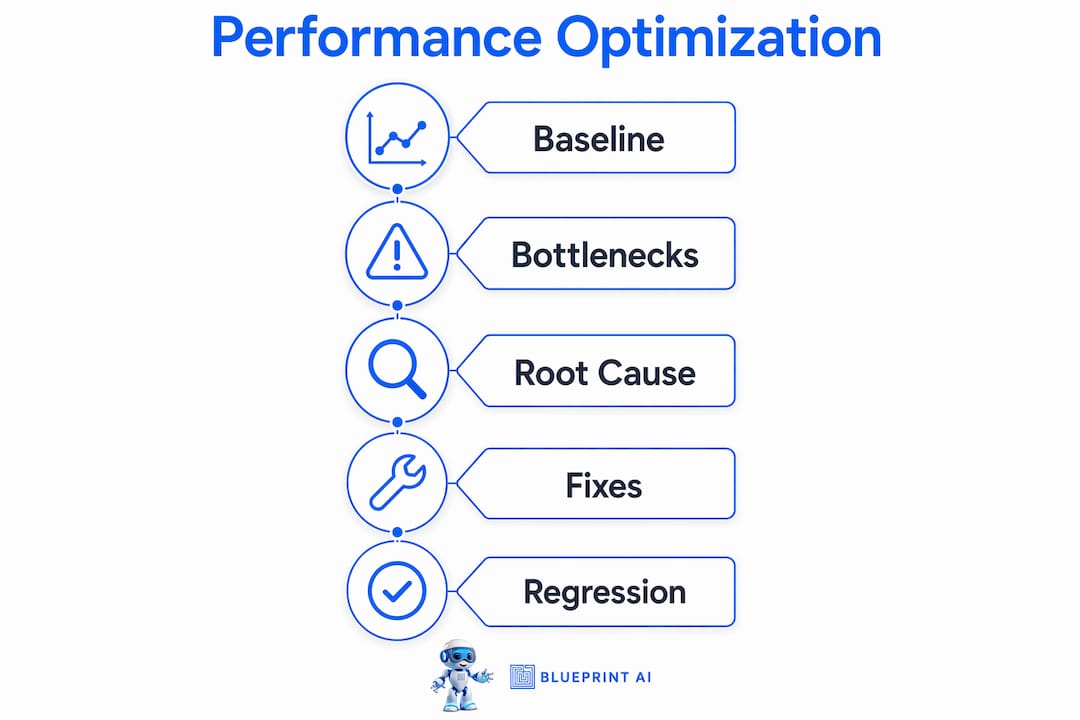
Phase 1: Baseline measurement. Profiling tools capture current behaviour across key metrics before any changes are made. Without a documented baseline, no improvement can be verified. Tools like Android's Perfetto, Memory Profiler, and Apple's Instruments give you precise timing and allocation data.
Phase 2: Bottleneck identification. Traces, flame graphs, and network waterfall diagrams isolate the specific components responsible for degradation, whether that is a slow database query, an oversized image asset, or a main-thread JavaScript block.

Phase 3: Root cause analysis. Engineers distinguish between symptoms (high Largest Contentful Paint, dropped frames) and causes (an unoptimised render pipeline, synchronous API calls blocking the UI thread). Treating symptoms without finding causes produces regressions.
Phase 4: Targeted intervention. Changes are scoped to the identified bottleneck. Common techniques include lazy loading, code splitting, query indexing, response caching, and asset compression.
Phase 5: Regression testing and re-measurement. The intervention is validated against the baseline and tested across device categories to confirm that gains do not introduce new failures.
Focus on P95 and P99 latency percentiles, not the median. The median hides the experience of your worst-affected users. Fixing the biggest delays for the slowest 5% of sessions produces the most visible improvement in real-world user satisfaction.
Prioritising by user impact matters here. A 20-millisecond increase in API latency on an internal admin panel warrants different urgency than a 2-second increase on a consumer-facing checkout screen. Observability platforms that surface real-user monitoring data make this triage far more reliable than lab testing alone. For fintech teams, performance in high-stakes flows like payments and authentication demands even tighter latency targets.
Practical techniques for improving app speed and responsiveness
Most performance gains come from a handful of high-impact areas. Here is where to focus.
Code optimisation
- Lazy loading and code splitting: load only what the first screen needs; defer everything else until the user requests it.
- Bundle size reduction: remove unused dependencies, enable code shrinking, and review third-party libraries regularly.
- Efficient algorithms: replace O(n²) loops with hash-based lookups where data sets grow.
Resource optimisation
- Memory management: clean up subscriptions and listeners, cancel pending requests when components unmount, and profile heap allocations with tools like Android Studio Memory Profiler or Xcode Instruments.
- Battery usage: batch background work, limit unnecessary wake-ups, and avoid polling when push notifications or event-driven patterns will do.
Network optimisation
- Caching: cache API responses and transformed images, but cap cache size so the memory fix does not become a memory problem.
- Batching and compression: combine multiple API calls where possible, compress assets, and use modern image formats like WebP.
- Reducing requests: fewer round trips mean lower latency, especially on mobile networks.
UI responsiveness
- Skeleton screens and optimistic UI: these techniques improve perceived performance without changing actual backend response times. Users experience the app as faster even when processing continues in the background.
- Main-thread hygiene: database reads, JSON parsing, and image decoding should never block the first paint or touch handling.
Pro Tip: Test on a mid-range or budget device, not just your development machine or a flagship phone. Low-end hardware reveals throttling and memory pressure that flagship devices mask entirely. If the experience is acceptable on a slower CPU and less RAM, higher-end devices benefit automatically.
Understanding how your mobile app architecture is structured before you start optimising saves significant rework. Architectural choices made at the prototype stage, like synchronous request chains or monolithic database schemas, cannot be resolved with surface-level fixes later.
Tools and technologies that support app performance improvement
Modern app performance work relies on three categories of tooling: observability platforms, profiling tools, and automation integrated into CI/CD pipelines.
Observability platforms collect metrics, distributed traces, and logs in real time, giving teams a unified view of where latency originates. IBM Instana is one example: it provides continuous, automated discovery and monitoring of application components, surfacing performance anomalies as they occur rather than after users report them. IBM Turbonomic complements this with dynamic resource management, automatically reallocating compute, memory, and storage to meet application performance targets without manual intervention.
Profiling tools like Android's Perfetto, Simpleperf, and Apple's Instruments let developers inspect CPU usage, memory allocations, and frame rendering at a granular level during development and testing.

CI/CD integration catches regressions before they reach production. Integrating performance tests into pipelines means every code change is validated against a performance baseline automatically.
| Tool category | Primary function | Key benefit |
|---|---|---|
| Observability platforms (e.g., IBM Instana) | Real-time metrics, traces, and logs | Surfaces anomalies before users report them |
| Resource automation (e.g., IBM Turbonomic) | Dynamic resource allocation | Maintains performance targets without manual tuning |
| Profiling tools (e.g., Perfetto, Instruments) | CPU, memory, and frame analysis | Pinpoints root causes at the code level |
| CI/CD performance testing | Automated regression detection | Prevents regressions from accumulating across releases |
| Field monitoring (e.g., Play Console vitals) | Real-user performance data | Validates lab results against production behaviour |
Automation does not replace profiling judgment, but it does prevent the slow accumulation of regressions that teams miss when performance testing is manual and infrequent. The combination of observability and automated testing is what separates teams that stay fast from teams that periodically scramble to recover lost ground.
The broader discipline of performance engineering treats performance as a continuous property of the system rather than a project phase, which aligns directly with how observability and automation tools are designed to be used.
Common misconceptions and best practices in app performance optimization
Several widely held beliefs about performance work cause more problems than they solve.
Caching does not always help. Excessive caching increases memory pressure and disk activity, hurting performance if unmanaged. Caching must be capped, given expiration rules, and paired with invalidation logic. Adding a cache without those constraints trades one problem for another.
AI-generated and third-party scripts carry hidden costs. Heavy reliance on auto-generated or third-party code can introduce redundant computations and high background resource consumption that are difficult to trace. The root cause of a performance issue buried inside a third-party SDK is far harder to fix than one in your own code. Understanding how AI integration patterns affect resource efficiency helps teams make informed decisions before adding dependencies.
Performance optimisation is not a one-time project. Even meeting all benchmarks today does not guarantee future performance as new features ship. Regressions accumulate if performance testing is treated as a pre-launch checklist rather than a continuous practice.
Best practices that hold up across platforms and team sizes:
- Test across a range of hardware, including mid-range devices representative of your actual user base.
- Fix the most visible bottleneck first, not the most technically interesting one.
- Integrate performance tests into CI/CD pipelines so regressions are caught at the pull-request stage, not after a release.
- Measure the real user journey before changing code; a generic "the app is slow" complaint is too broad to act on.
- Keep assets, memory use, and background behaviour under active control across every release cycle.
Pro Tip: Distinguish perceived performance from measured performance before deciding what to fix. Skeleton screens and optimistic UI updates can dramatically improve how fast an app feels without touching backend latency at all. Sometimes the highest-return fix is a UI change, not a server-side one.
Key takeaways
App performance optimization is a continuous, iterative discipline: baseline measurement, targeted fixes, and regression testing must repeat across every release cycle to maintain speed and stability.
| Point | Details |
|---|---|
| Optimise for P95/P99, not the median | Fixing the worst 5% of sessions produces the most visible improvement for real users. |
| Crash-free rate benchmark | The industry standard is 99.95% or higher; anything above 2% needs immediate attention. |
| Test on mid-range devices | Low-end hardware reveals throttling and memory pressure that flagship devices hide. |
| Caching requires constraints | Always cap cache size and add expiration rules, or memory pressure replaces the original problem. |
| Integrate performance into CI/CD | Automated regression detection at the pull-request stage prevents slow accumulation of performance debt. |
Start with a solid blueprint before you optimise
Performance problems are far cheaper to prevent than to fix after launch. Blueprintbot generates detailed software blueprints covering system architecture, API designs, database schemas, and development roadmaps in seconds, giving your team a clear technical foundation before a single line of code is written. When your architecture is planned with performance in mind from the start, the iterative optimisation work described in this guide becomes incremental improvement rather than structural rework.
Explore worked software blueprints to see how structured planning translates directly into faster, more stable applications, or use Blueprintbot's free planning tools to baseline your next project's architecture before development begins.